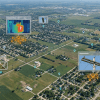
Industrial site visual inspection
Survey report
200 oil & gas and energy executives were surveyed worldwide to gain a deeper understanding of visual inspection drivers, practices, and trends.
Get the full report to learn about:
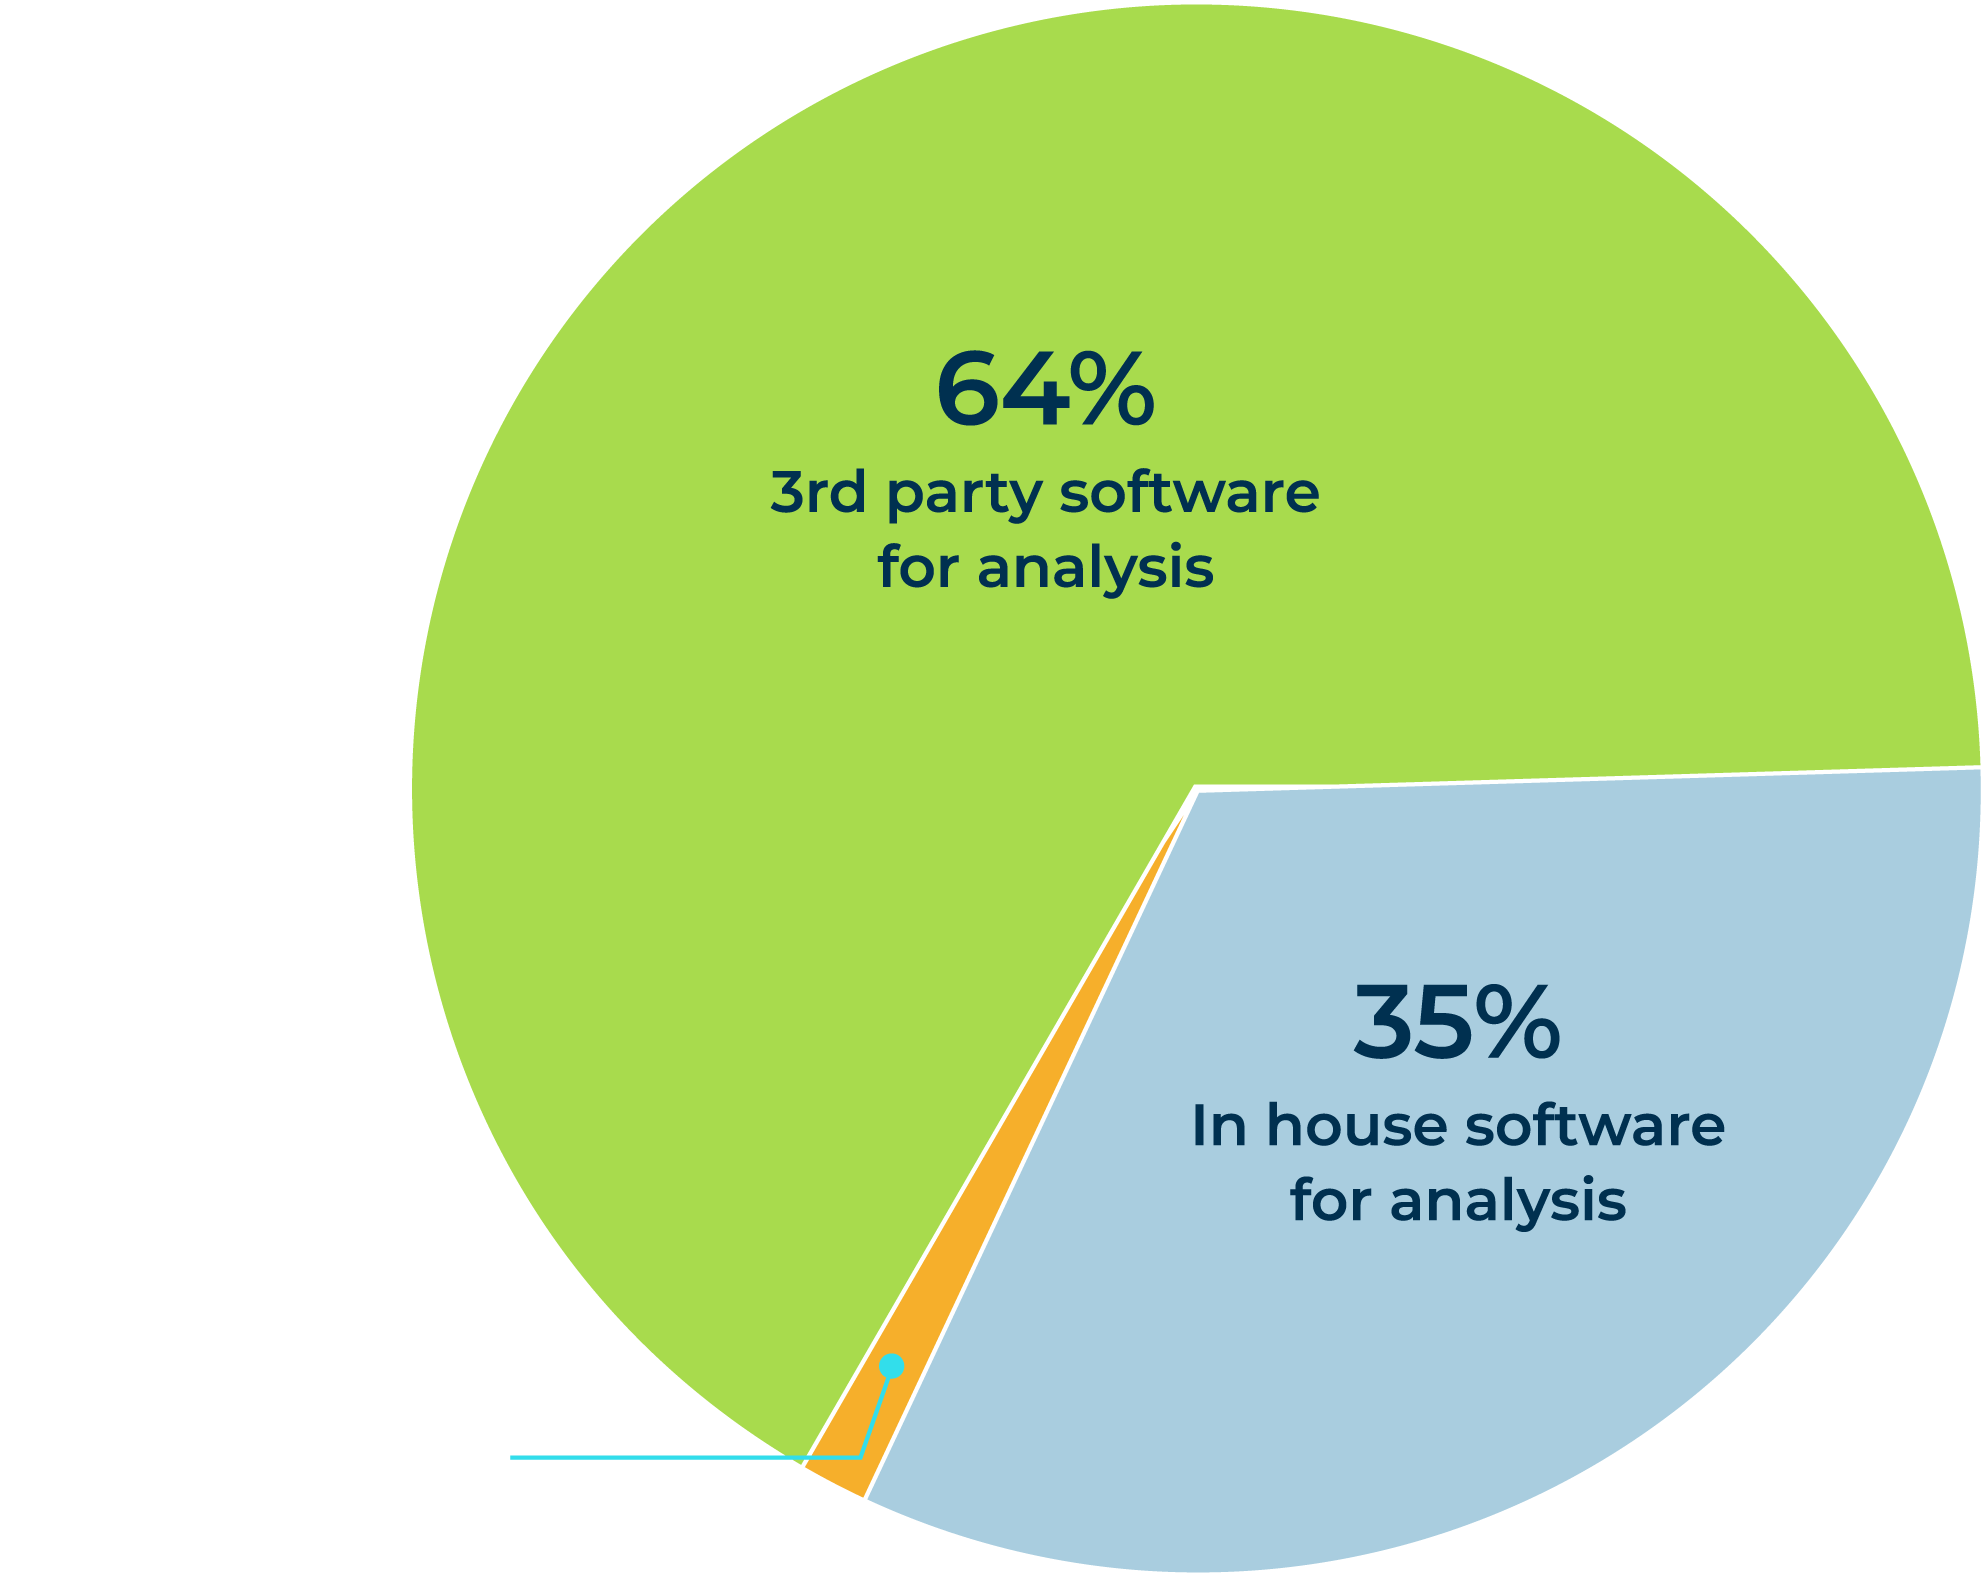
- Current technologies used for promoting asset integrity
- Inspection frequency and average number of inspectors per site
- Visual inspection digitalization and automation